To see the first three tasks of MARS-lab go here.
Task 4
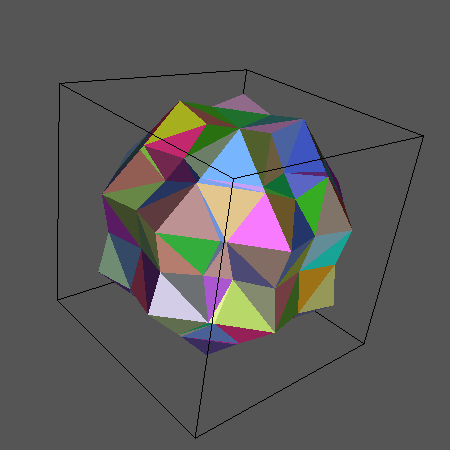
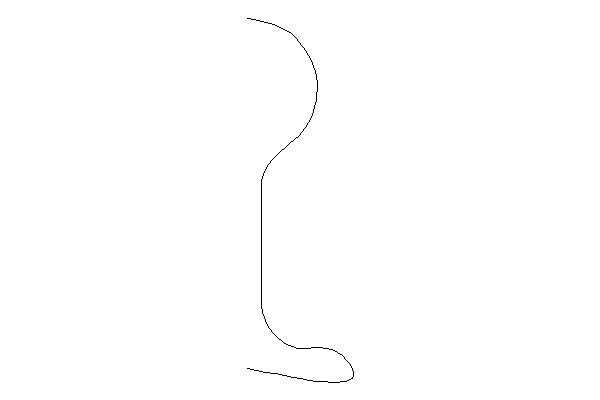
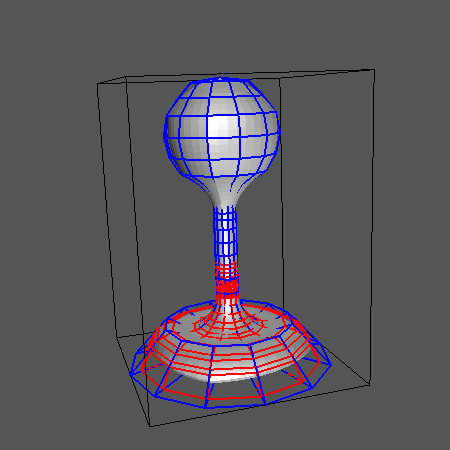
In this task a spline should be rotated to generate a 3d object. This object was displayed using Geomview.
Input
rotate Output
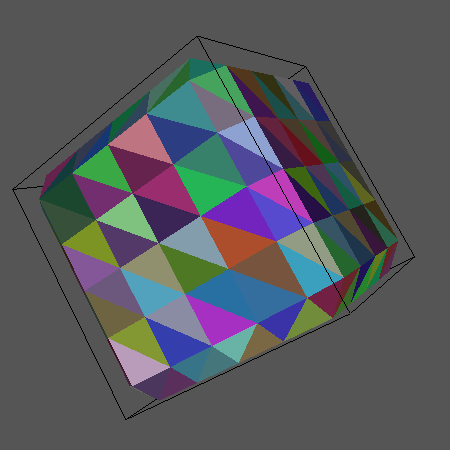
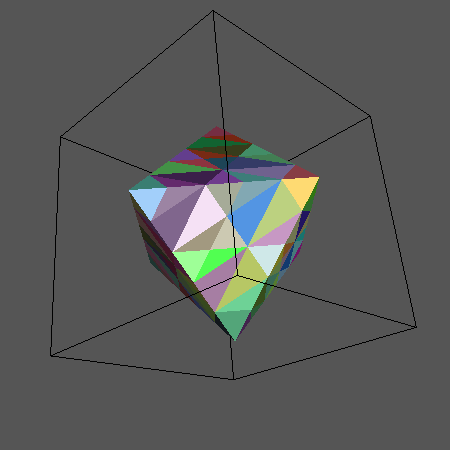
Task 5
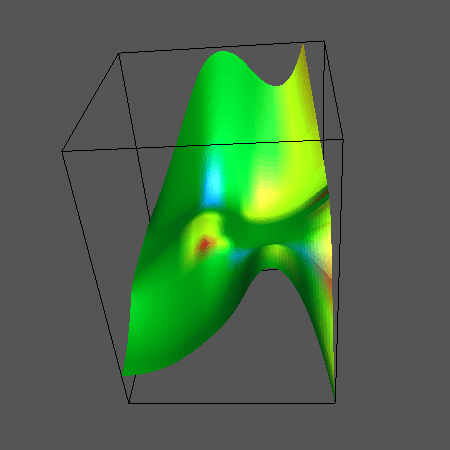
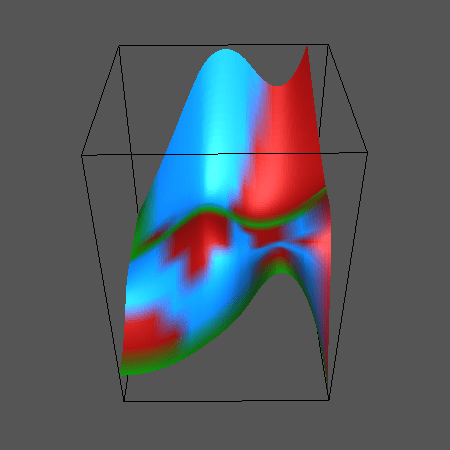
The task was to visualize the steepness of a three dimensional spline. Based on different parameters, different measurements are displayed. The following shows two examples of the visualization.
Linear colour translation
Classification
Task 6